
Dental Clinic
Google Ads performance, conversion quality and acquisition efficiency.
View the case studyBertrand & Bernard · Case Study 03
As Digital Marketing Manager, I managed paid acquisition and conversion optimisation across multiple businesses, covering Meta and Google Ads, campaign structure, audience strategy, landing-page testing, Shopify CRO, performance reporting and full-funnel optimisation.
Selected performance marketing and conversion optimisation work across different businesses and growth models. Choose a card to view the complete case study below.
Google Ads performance, conversion quality and acquisition efficiency.
View the case study
Reframing a feature-gated product around acres under monitoring to improve comprehension and paid conversion.
View the case study
ICP, verified data, multi-step sequences and deliverability-safe sending for an exhibition booth services company.
View the case studyThree connected pricing and product-framing gaps were limiting product understanding and trial-to-paid potential.
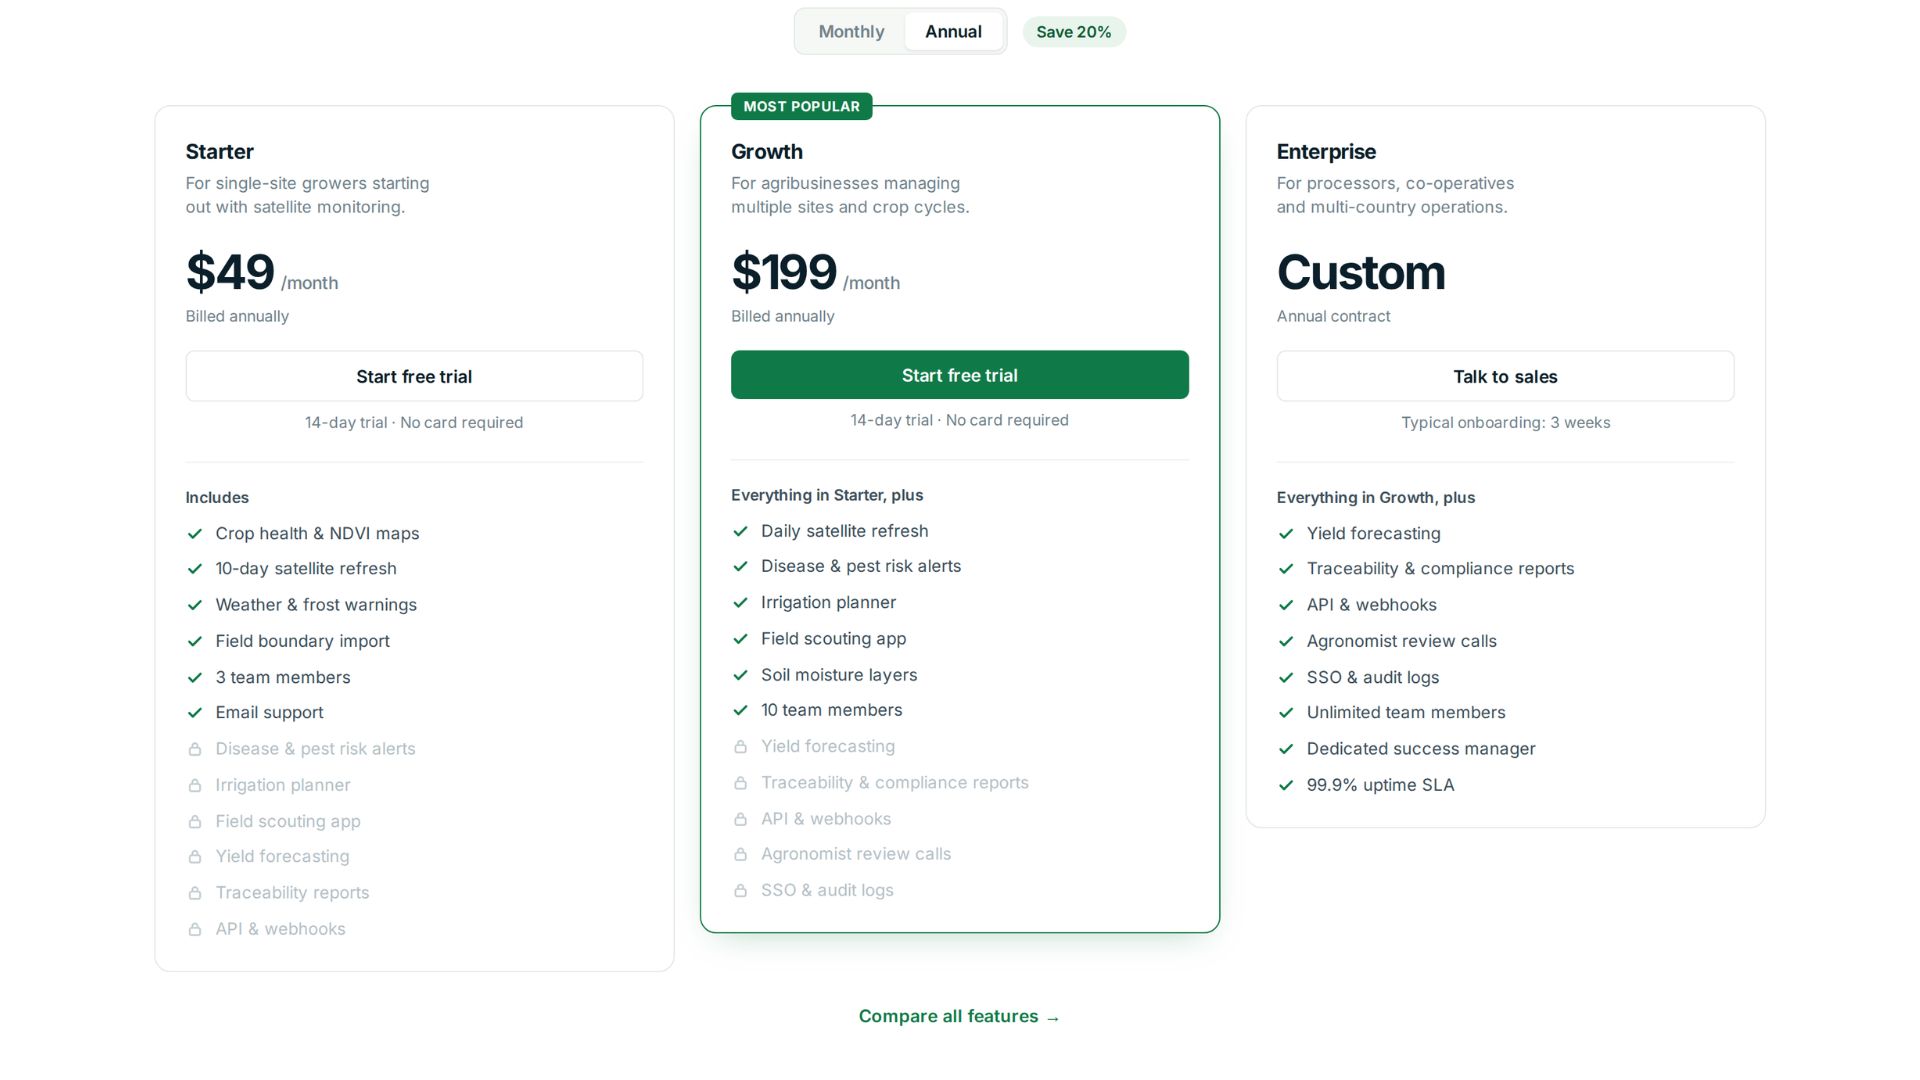
01 Free tools set the category baseline. In a market with free crop-health maps and basic advisory, the platform’s higher-value tools across disease risk, irrigation, harvesting and compliance needed clearer differentiation during the buying journey.
02 Feature gating hid the product’s real value. The entry tier excluded disease alerts, irrigation planning, yield forecasting and scouting tools. Buyers were evaluating a limited version of the product instead of experiencing the capabilities that differentiated it.
03 Pricing created avoidable buying friction. The pricing page organised value around feature access rather than the amount of land being monitored. The model needed to align with a unit customers already understood and used for budgeting.
The pricing model was rebuilt around land under monitoring, with the product experience and measurement framework aligned to the same logic.
Instead of restricting capabilities by plan, the redesigned model gave every plan access to the full product. Pricing moved to acres under monitoring, a unit customers already understood and used for budgeting.
The redesigned model included disease alerts, irrigation planning, yield forecasting and scouting tools across every plan.
Plans were metered by acres under monitoring rather than by access to different product capabilities.
The buying experience presented the offer around monitored acreage, making the commercial model easier to understand and budget for.
The signup flow and in-app plan selector were redesigned to present the acre-based model consistently.
Entitlement logic was mapped to the redesigned model, with a plan covering conversion, revenue and customer-quality outcomes.
A grower with 800 acres and a co-operative with 90,000 acres may need the same tools, but they have different amounts of land to monitor. Acre-based pricing makes that difference easier to understand and scale.
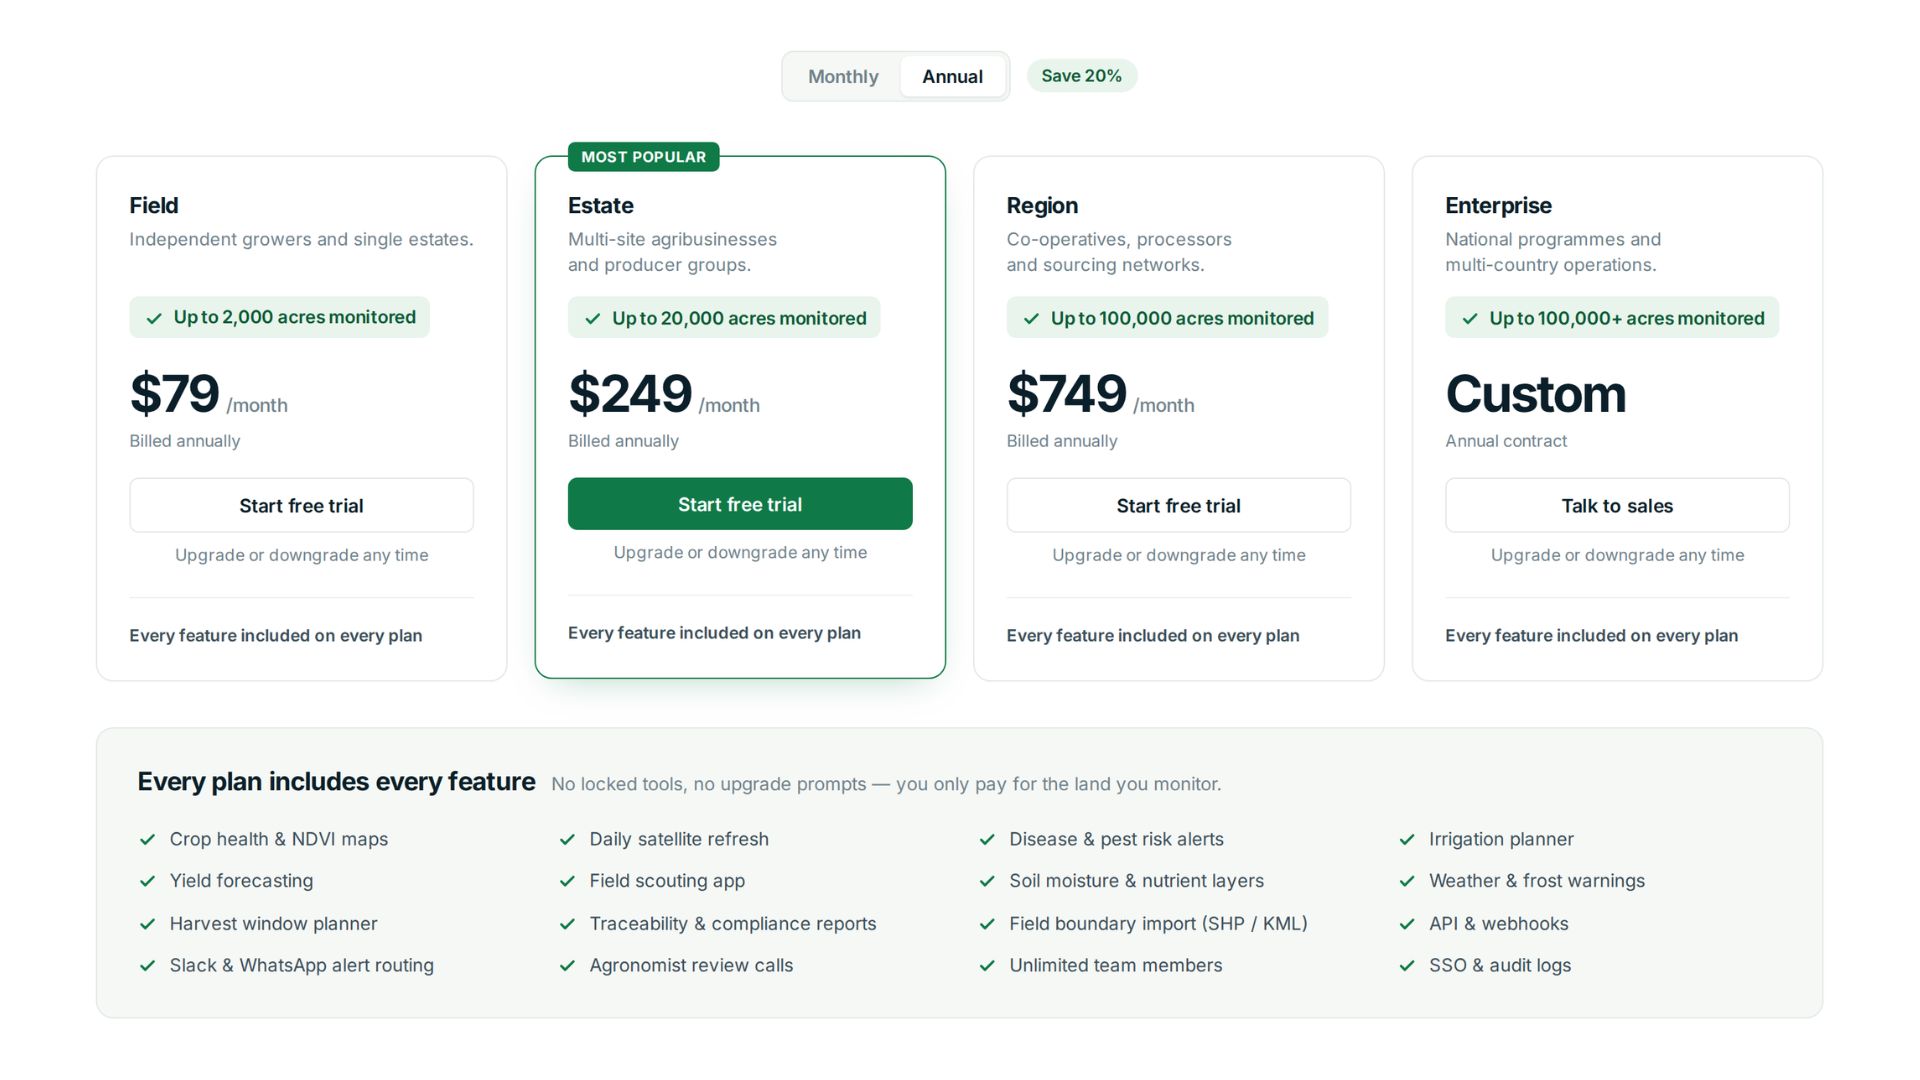
The redesign was structured for a controlled test comparing the feature-gated model with the proposed acre-based variant across conversion, revenue and retention metrics.
| Metric | What it measures | Success signal |
|---|---|---|
| Trial starts | Initial response to the redesigned pricing experience | More qualified visitors begin a trial |
| Trial to paid | Product understanding and purchase intent | A higher share of trials become customers |
| New customers | Overall acquisition impact | Customer volume increases |
| Revenue per account | Effect of the new entry model | Any decline remains commercially manageable |
| New revenue booked | Total commercial impact | Customer growth produces more revenue |
| 90-day retention | Customer quality and fit | Retention remains stable |
The model would succeed commercially if increased customer volume generated more total revenue despite a lower average starting price.
Ninety-day retention would serve as a quality guardrail, checking that easier entry continued to attract suitable long-term customers.
The experiment would evaluate whether increased customer volume could offset a lower starting price without weakening retention or long-term customer quality.
This case study presents real pricing strategy and experiment-design work. Test results are omitted because the original reporting source is no longer available.
Three connected outbound gaps had to be solved before outreach could scale safely and remain relevant.
01 Targeting needed exhibition-level precision. The client needed to reach companies actively preparing for trade shows, not a broad list of businesses. The ICP had to connect the right company, decision-maker and upcoming exhibition so each message arrived in a commercially relevant context.
02 Prospect data had to support personalisation. Scaling with incomplete or unverified records would reduce relevance, increase failed deliveries and weaken campaign quality. The database needed cleanup, verification and segmentation before it could reliably support personalised variables and message variations.
03 Sending and follow-up needed a safe system. A single inbox or one-off email could not create repeatable opportunity flow. The campaign required warmed infrastructure, controlled daily volume and a multi-step sequence that could follow up consistently without sacrificing deliverability.
Targeting, prospect data, sending infrastructure and follow-up were built as one connected outbound system rather than as separate campaign tasks.
The campaign combined exhibition-level targeting, verified prospect data, warmed infrastructure and a multi-step sequence so outreach could scale while remaining relevant and deliverability-safe.
Companies, decision-makers and upcoming trade shows were connected so each message reached a commercially relevant prospect.
The lead database was sourced, cleaned, verified and segmented before it was used for personalised variables and message variations.
44 warmed inboxes were capped at 25 emails per account per day, creating a controlled daily capacity of 1,100 emails.
Campaigns used multi-step sequences, message variations, personalised variables and soft calls to action.
Reply patterns guided ongoing iteration, helping keep the sequence focused on consistent follow-up rather than one-off sends.
Owned ICP definition, prospect-data sourcing and cleanup, segmentation, campaign setup, sequence operations and initial scripting.
A Bertrand & Bernard partner coached me through the copywriting process, helping sharpen message angles, follow-ups and reply-focused calls to action.
The distributed infrastructure delivered 7,700 sends without relying on a single inbox or uncontrolled volume, producing measurable reply and opportunity flow over seven days.
| Metric | Result | Campaign context |
|---|---|---|
| Total sent | 7.7K | Across a seven-day campaign |
| Open rate | 67.8% | Strong platform-recorded engagement |
| Reply rate | 2.06% | Conversation-focused outreach |
| Opportunity | 1 | $80K in potential pipeline value |
44 warmed inboxes at 25 emails per account per day created capacity for 1,100 daily sends and 7.7K sends in seven days.
The multi-step sequence created consistent follow-up without relying on one-off sends.
Campaign metrics are platform-reported. Client and prospect identifiers have been removed for confidentiality.
After the initial outbound system was implemented and validated, the company continued using and scaling the same infrastructure internally.
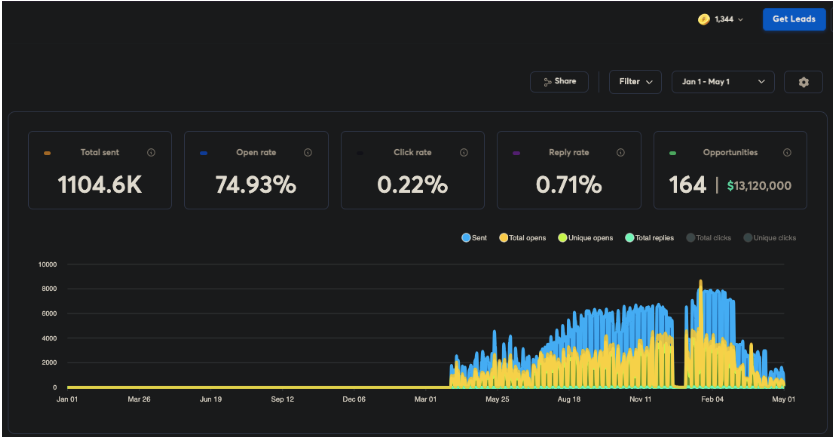
1.1M+total sends
164opportunities
$13.12Mpotential pipeline value
These later platform-reported account totals are shown separately and are not attributed solely to the initial seven-day campaign. Pipeline represents opportunity value, not confirmed revenue.
Three connected account gaps were limiting conversion output and making paid acquisition more expensive than necessary.
01 Conversion signals were limiting optimisation. Lead-form and conversion tracking were not providing Google Ads with dependable signal quality. With limited measurement data, automated bidding had less reliable information to identify and optimise toward users more likely to complete a valuable action.
02 Underperforming activity was consuming budget. Weak campaigns and experiments were creating budget bleed, while spend was not concentrated strongly enough around higher-intent queries and campaigns. The account needed clearer pruning and allocation decisions before additional budget could work efficiently.
03 Reach was not producing efficient acquisition. From January to June 2023, approximately $68.9K in spend and 394K impressions generated 56 measured conversions at roughly $1.23K per conversion. With an average customer value of about $1.8K, acquisition efficiency needed significant improvement.
Five connected changes strengthened measurement, removed inefficient activity and redirected spend toward higher-intent opportunities.
Lead-form and conversion signals were improved, giving optimisation clearer and more dependable measured actions.
More conversion history gave Maximise Conversions a stronger foundation for identifying users likely to complete valuable actions.
Underperforming campaigns and experiments were reduced, paused or replaced to limit wasted spend.
Spend was redirected toward campaigns and queries more likely to generate trackable lead actions.
New Zealand and US campaigns introduced additional audience pools beyond the original market setup.
From Jul 1 to Dec 25, 2023, measured conversions rose from 56 to 361 while cost per conversion fell by 83.7%, with only a 5.2% increase in media spend.
| Metric | JAN-JUN 2023 | Jul 1–Dec 25, 2023 | Change |
|---|---|---|---|
| Spend | ~$68.9K | ~$72.5K | +5.2% |
| Conversions | 56 | 361 | +544.6% |
| Cost / Conversion | ~$1.23K | ~$201 | 83.7% lower |
| Impressions | 394K | 337K | -14.3% |
Spend increased by only 5.2%, while measured conversions rose from 56 to 361.
Impressions declined by 14.3%, while conversions increased and cost per conversion fell by 83.7%.
Google Ads spend and cost figures are rounded USD equivalents converted from INR using the 2023 average exchange rate. Average customer value is based on client-provided data. ROAS is excluded because revenue tracking was unreliable.
Quick Clean Laundry Systems
Built Quick Clean’s commercial growth system across hospitality, healthcare and retail through ICP-led qualification, sector positioning, sales enablement and connected CRM workflows.
20–25 SQLs/quarter · 15–17 retail leads/month
View the case studyAccountX
Built the company’s acquisition foundation across 10 markets through market-specific ICP research, outbound email, LinkedIn, SEO and sales enablement.
10 markets · 8–10 qualified leads/month
View the case study